What next? Making the leap from coding to analysis
So you spend weeks or months coding all your qualitative data. Maybe you even did it multiple times, using different frameworks and research paradigms. You've followed our introduction guides and everything is neatly (or fairly neatly) organised and inter-related, and you can generate huge reports


So you spend weeks or months coding all your qualitative data. Maybe you even did it multiple times, using different frameworks and research paradigms. You've followed our introductory guides to qualitative analysis and everything is neatly (or fairly neatly) organised and inter-related, and you can generate huge reports of all your coding work. Good job! But what happens now?
It's a question asked by lot of qualitative researchers: after all this bruising manual and intellectual labour, you hit a brick wall. After doing the coding, what is the next step? How do you move the analysis forward?
How can I get from qualitative coding to analysis?
In short, here's how to get from coding to analysis:
- Match up your coding to your research questions: figure out how they connect by asking which codes and themes correspond to your questions.
- Analyse your coding structure: why did you cluster or group your codes in this way? Why did you word the code names that way? What might this say about the patterns in your data?
- Compare and contrast: identify the similarities and differences across your whole dataset, and try to explain them.
- Match your findings to the literature, and re-explore your secondary sources: how does your data correspond to (or diverge from) the arguments in the existing literature?
- Keep asking 'why': why did a participant say or do that? What were their motivations? What social contexts had an impact on their decision?
- Don't panic – even if you find you have to go back to your data and code again: qualitative analysis is iterative, so repeated cycles of coding and analysis are to be expected. Analysis is rarely as linear as you might have originally planned.
The important thing to remember is that coding is not really analysis. Coding is often a precursor to analysis, in the same way that a good filing system is a good start for doing your accounts: if everything is in the right place, the final product will come together much easier. But coding is usually a reductive and low-level action, and it doesn't always bring you to the big picture. That's what the analysis has to do: match up your data to the research questions and allow you to bring everything together. In the words of Zhang and Wildemuth, you need to look for “meanings, themes and patterns”.
In many methodologies, like thematic analysis, one part of getting from coding to analysis is making the leap from codes to themes:

We'll now take a look at each of these in more detail.
Match up your coding to your research questions
Now is a good time to revisit the research question(s) you originally had when you started your analysis. It's easy during the coding process to get excited by unexpected but fascinating insights coming from the data. However, you usually need to reel yourself in at this stage, and explore how the coded data is illuminating the quandaries you set out to explore at the start of the project.
Look at the coded framework, and see which nodes or topics are going to help you answer each research question. Then you can either group these together, or start reading through the coded text by theme, probably more than once with an eye for one research question each time. Don't forget, you can still tag and code at this stage, so you can have a category for 'Answers research question 1' and tag useful quotes there.
One way to do this in Quirkos is the 'Groups' function, which allows you to assign codes/themes to more than one grouping. You might have some coded categories which would be helpful in answering more than one research question: you can have a level for each research question, and your codes/categories can belong to multiple appropriate levels. That way, you can quickly bring up all responses relevant to each research question, without your grouping being non-exclusive.
Analyse your coding structure!
It seems strange to effectively be analysing your analysis, but looking at the coding framework itself gets you to a higher meta-level of analysis. You can grouping themes together to identify larger themes and coding. It might also be useful to match your themes with theory, or recode them again into higher level insights. How you have coded (especially when using grounded theory or emergent or in vivo coding) can reveal a lot about the data, and your clusterings and groupings, even if chosen for practical purposes, might illuminate important patterns in the data.
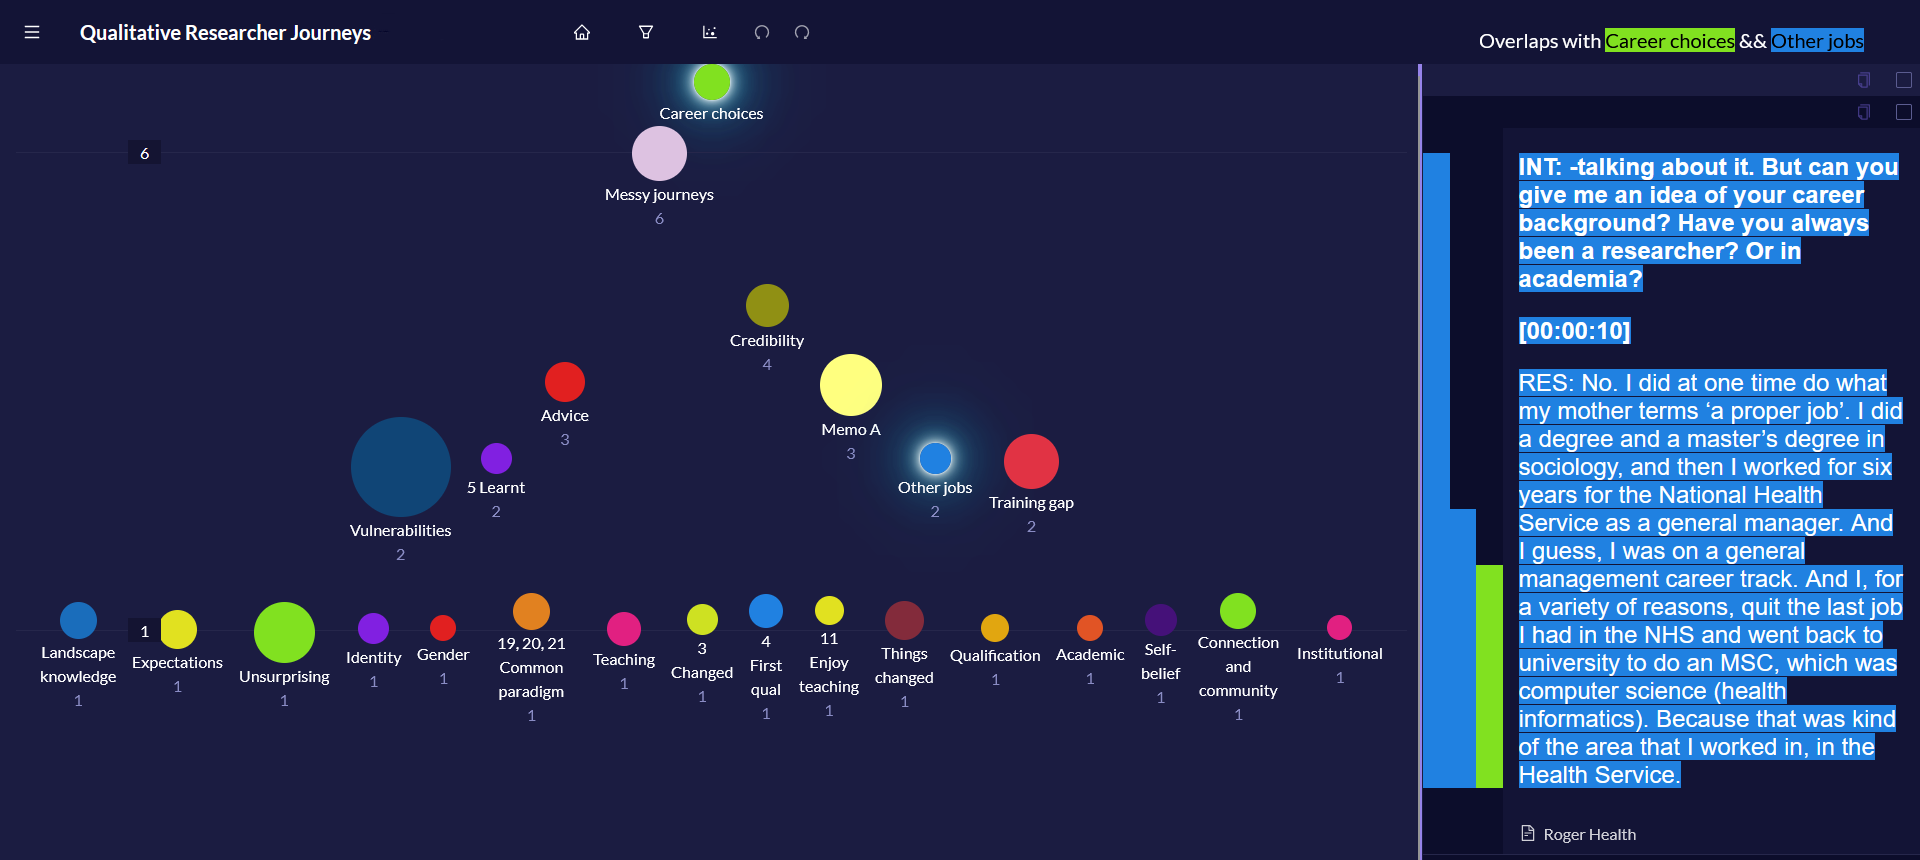
In Quirkos, you can also use the overlap view to show relationships between themes. This illustrates in a graphical chart how many times sections of text 'overlap' - in that a piece of text has been coded with both themes. So if you have simple codes like 'happy' or 'disappointed' you can what themes have been most coded with disappointment. This can sometimes quickly show surprises in the correlations, and lets you quickly explore possible significant relationships between all of your codes. However, remember that all these metrics are quantitative, so are dependent on the number of times a particular theme has been coded. You need to keep reading the qualitative text to get the right context and weight, which is why Quirkos shows you all the correlating text on the right of the screen in this view.
Compare and contrast
Another good way to make your explorations more analytical is to try and identify and explain differences: in how people describe key words or experiences, what language they use, or how their opinions are converging or diverging from other respondents. Look back at each of the themes, and see how different people are responding, and most importantly, if you can explain the difference through demographics or different life experiences.
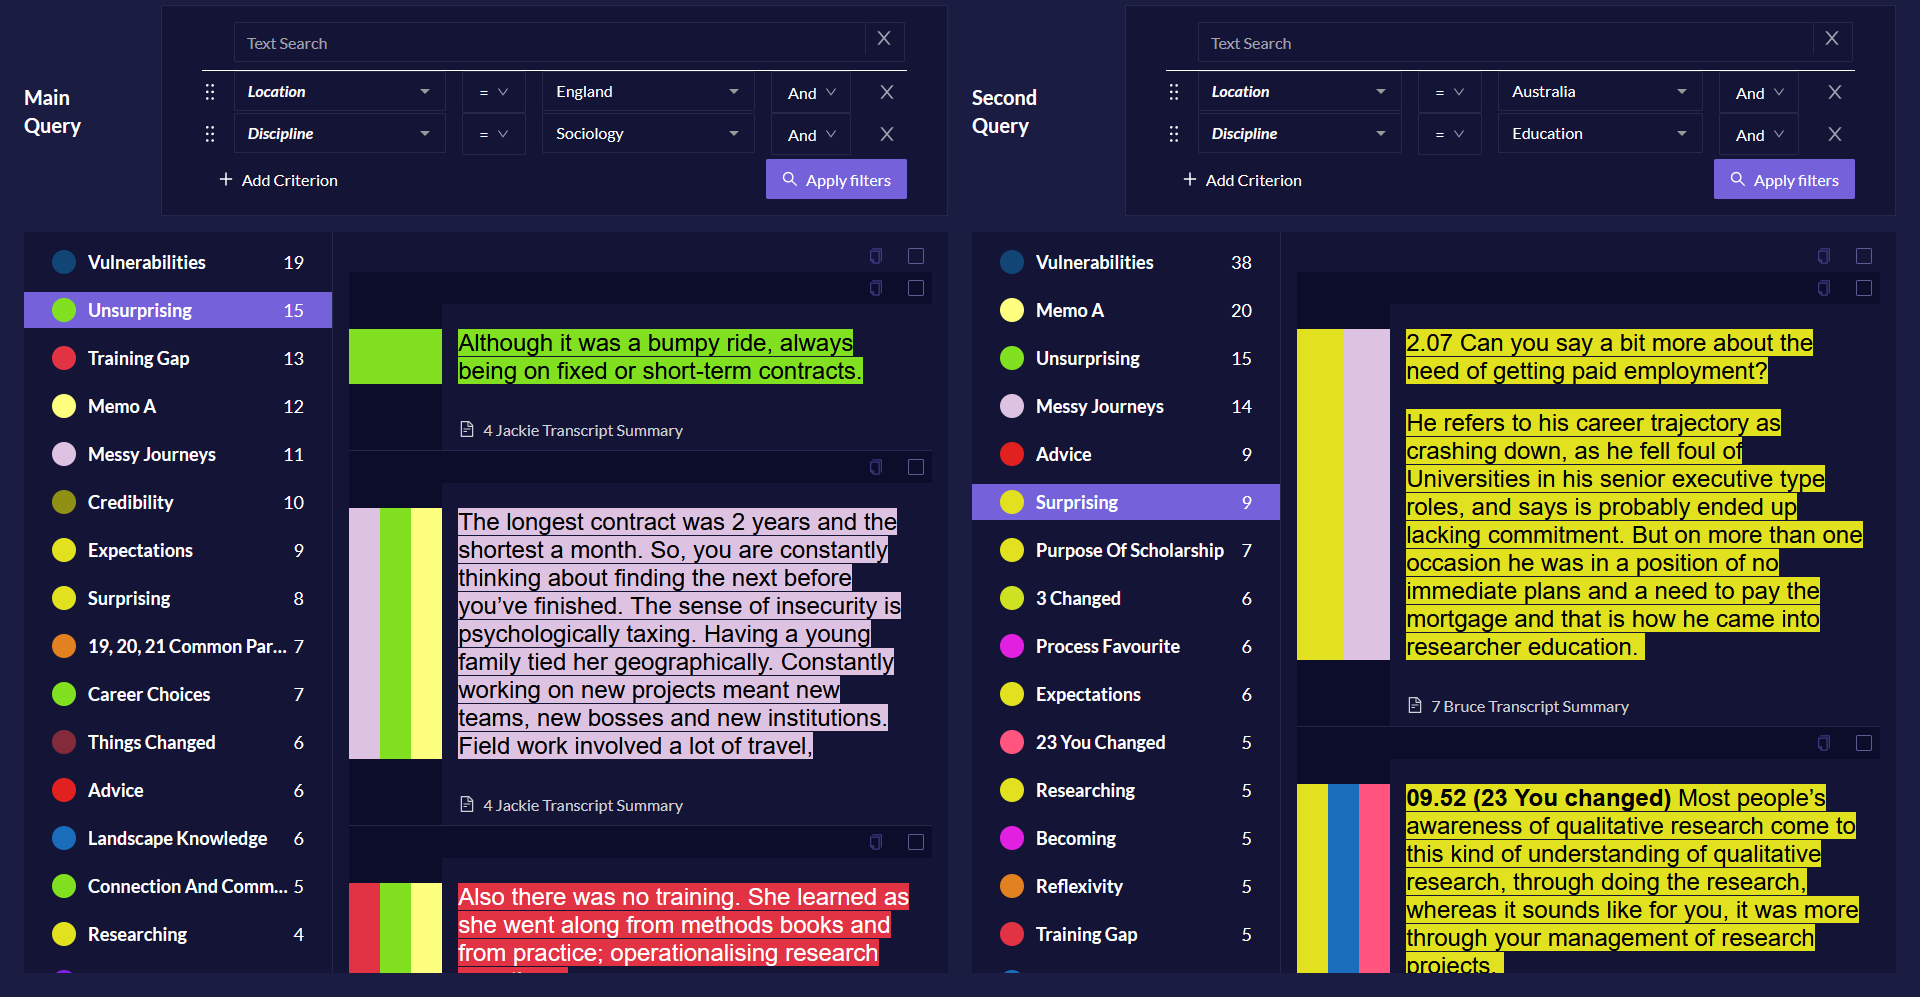
In Quirkos this process can be assisted with the query view, which allows you to see responses from particular groups of sources. So you might want to look at differences between the responses of men and women, as shown below. Quirkos provides a side-by-side view to let you read through the quotes, comparing the different responses. This is possible in other software too, but requires a little more time to get different windows set up for comparison.
Match and re-explore the literature
It's also a good time to revisit the literature. Look back at the key articles you are drawing from, and see how well your data is supporting or contradicting their theory or assumptions. It's a really good idea to do this (not just at the end) because situating your finding in the literature is the hallmark of a well written article or thesis, and will make clear the contribution your study has made to the field. But always be looking for an extra level of analysis, try and grow a hypothesis of why your research differs or comes to the same conclusions – is there something in the focus or methodology that would explain the patterns?
Keep asking 'Why'
Just like an inquisitive 6 year old, keep asking 'Why?'! You should have multiple levels of Why, with explanations in qualitative focus usually explaining individual, then group, and all the way up to societal levels of causation. Think of the maxim 'Who said What, and Why?'. The coding shows the 'What', exploring the detail and experiences of the respondents is the 'Who', the Why needs to explore not just their own reasoning, but how this connects to other actors in the system. Sometimes this causation is obvious to the respondent, especially if articulated because they were always asked 'why' in the interview! However analysis sometimes requires a deeper detective type reading, getting to the motivations as well as actions of the participants.
Don't panic!
Your work was not in vain. Even if you end up for some reason scrapping your coding framework and starting again, you will have become so much more engaged with your data by reading it through so closely, and this will be a great help knowing how to take the data forward. Some people even discover that coding data was not the right approach for their project, and use it very little in the final analysis process. Instead they may just be able to pull together important findings in their head, the time taken to code the data having made key findings pop out from the page.
And if things still seem stuck, take a break, step back and print out your data and try and read it from a fresh angle. Wherever possible, discuss with others, as a different perspective can come not just from other people's ideas, but just the process of having to verbally articulate what you are seeing in the data.
Remember to check out Quirkos, a software tool that helps constantly visualise your qualitative analysis, and thus keep your eye on what is emerging from the data. It's simple to learn, affordably priced, and there is a free trial for all devices (including Windows, Mac and Linux as well as mobile devices) so you can see for yourself if it is the right fit for your qualitative analysis journey. Good luck!