Quirkos Web - Step-by-step guide
Accessing Quirkos Web
Before using Quirkos Web, you will need to register for an account, but there's a 14 day free trial.
7 easy steps
Qualitative analysis in Quirkos Web can be broken down into seven sequential steps:
1. Creating a project
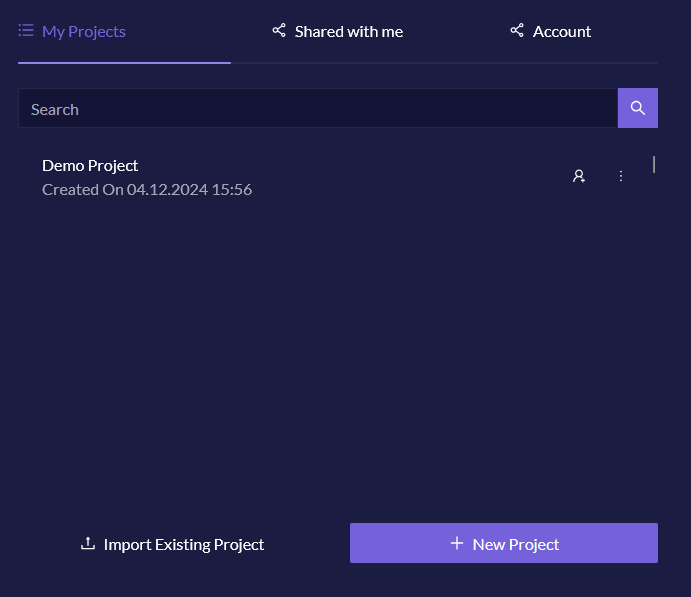
Login to the Quirkos Web page, and you will be able to create new projects in your account, or work with projects others have shared with you.
Quirkos stores all your work in a project, and this must be created before you can import your qualitative data. Quirkos automatically saves your work as you go, and anywhere you login you'll be able to keep working on your data. Just close your browser or tab at any time, and your work will have been already saved.
After you login, Quirkos Web displays a list of your recently used projects, and you can create a new project by clicking on the '+ New Project' button. Give your project a name (note this can't be changed later) and click create. You'll then have a new empty project to start work with.
2. Import your data
Quirkos only works with text data and you can currently import files directly from Word files (.docx), Portable Document Format (.pdf) and Excel spreadsheets (.xlsx). With Quirkos Transcribe, you can also import most video (.mp4, .mov, etc) and audio files (.mp3, .wav, etc), which will be transcribed into text automatically for you.
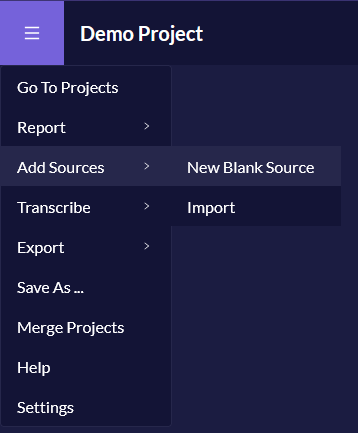
It's also possible to use the copy and paste functions on your computer to put data into a new blank source in Quirkos. This is useful to bring in data from a webpage (like a blog article, or social media stream) or even if you just want a small part of larger documents. Finally, you can create a blank source that you can write directly into. This works well for recording ongoing memos, and copying and pasting from multiple sources.
These options are available by clicking on the main menu button on the top left of the screen. If choosing the 'Import' option you will get a dialogue to select one or more text files from your computer. All your sources can be edited at any time by right clicking on the ... button at the top left of the source, and choosing Edit. After you've finished your changes, click the tick to save them.
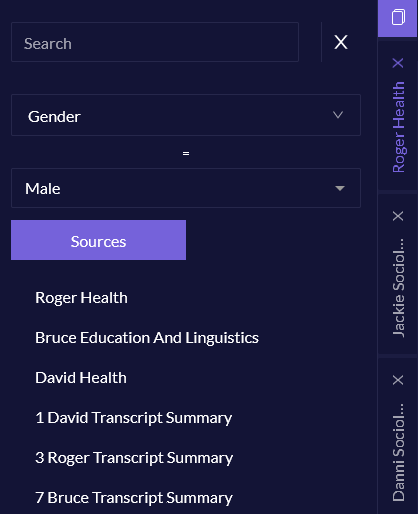
You will see your text sources shown as a column on the right side of the screen. At the left of the source is a scroll-able list of tabs which display other sources in the project. At the top of this is the Source Browser button which shows a list of all the sources in the project, and allows you to search for a source name, or filter by source properties. Clicking on a source here will load it in the text view column.
3. Describe your sources
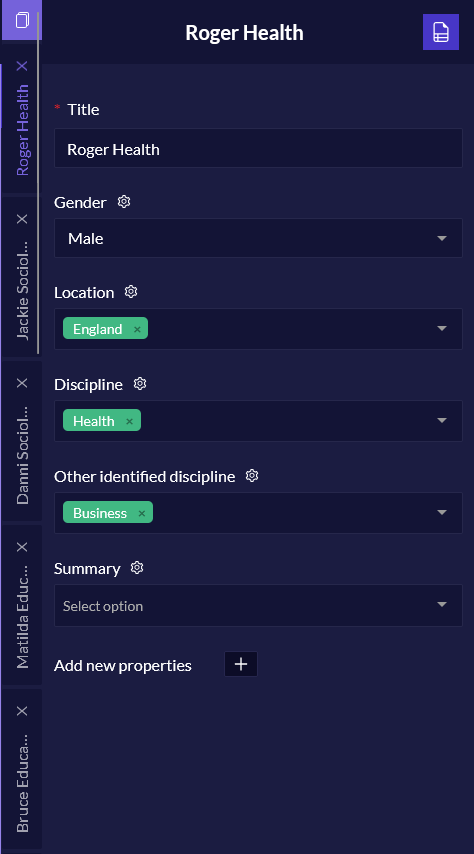
Quirkos lets you define any number of properties for your sources, to describe things like gender, age, name, location or any other information on the source. Just click on the cog button on the top right of the screen to change the Source Properties for the current source. A category like 'Age' is a property, and an answer like '42' is the value for that source. You can use these properties later to explore your data, so that you could see all the results, for example from men or people between a certain age range.
Click on the [+] button at the bottom of this screen underneath the 'Add new properties' button to add a new property and one or more values. Click Save when you are done with the new property. This is also how you would create and store discrete response questions in a questionnaire.
4. Create your themes
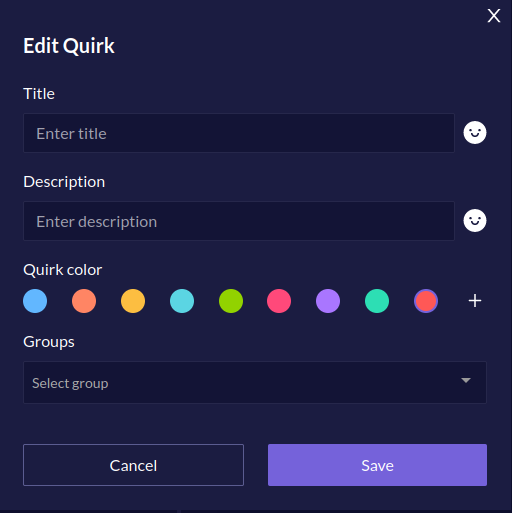
What topics do you want to pick out from your data? In Quirkos these codes, themes or 'nodes' are represented by coloured bubbles which grow each time you add some text to them. They are used to group together sections of the text (or highlights) on a particular topic, such as Family, Voting, or Disagreements. They are shown in the blue 'canvas' area on the left side of the screen. You can create a new topic category by right clicking anywhere on the canvas view area on the left of the screen. A new bubble is created and a dialogue pops up to let you change the name, description and colour of the bubble. Right clicking on a bubble later gives you options to edit these properties again. These topic bubbles, or 'Quirks' can be moved anywhere around the canvas, by dragging and dropping them. You can also create a new code containing a section of text by dragging and dropping some text onto a blank part of the canvas.
It's also possible to group your themes, which is again a simple drag and drop. Just drop one bubble onto another, and it becomes a nested sub-category. For example you might have a category for Bread, and many different types as sub-categories, like Brown, Wholemeal, Rye, Sour-dough. You can even have sub-sub categories such as Bread -> Brown –> Seeded.
5. Code your data
Once you have some topic bubbles, you can code data to them by selecting some text, and dragging and dropping that selection onto the bubble. Every time you do this, you will see the bubble get a little bigger, and a colour coded highlight will appear around the section of text in the source. You can remove a piece of coded text by right clicking at any time on the highlighted stripe in the side column.
To see everything you've coded in a node, double click on the bubble, and all the results will be displayed from across all sources. Clicking the Home button will take you back to the canvas view.
Now it's a process of going through and analysing your data, assigning sections of the text to themes as you go along. One piece of text can be assigned to any number of themes, and there is a text search function that can help find comments on certain topics.
6. Explore your data
Once you have coded some or all of your sources, there are many tools in Quirkos that let you explore the data, looking for trends and surprises.
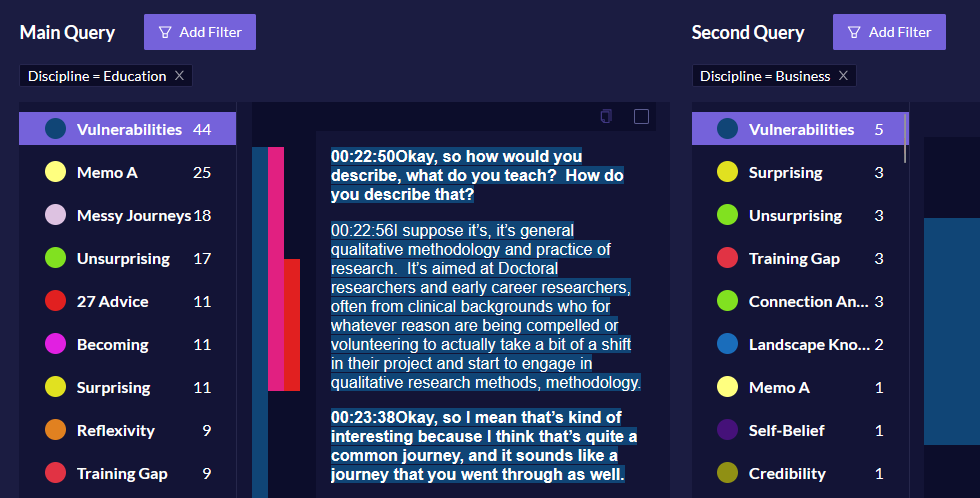
Using the Query view, you can run filtered searches to bring out coded data from particular kinds of sources, or work done by particular people during certain time periods.
Right clicking on any of the topic bubbles will allow you to show an 'overlap' view, which visualises connections between the themes based on how often they are coded together.
7. Export your coded data
There are many different ways to export your data to explore further or share with others.
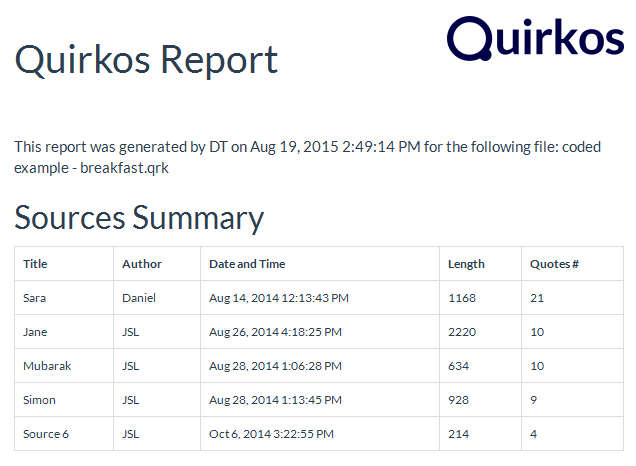
Generate a customisable report which shows summaries or all the detail of your project, with graphs and visual views.
Create a colour highlighted Word document which shows all your coding.
Export the data as a spreadsheet, to do statistical analysis in Excel or SPSS, and to bring into other software packages.
Try today!
Ready to give Quirkos a try? Register for a free 14-day trial of Quirkos today,
with no restrictions on features or
projects.with no restrictions on features or
projects.
Want to learn more? Read more about our features or see Quirkos in action!